Data Viz

Cascade 2023

Cascade.app is a platform that enables companies to integrate all its operational and financial data and visualize it in way that help manage the whole company estrategy alignment.

Case study

Objective

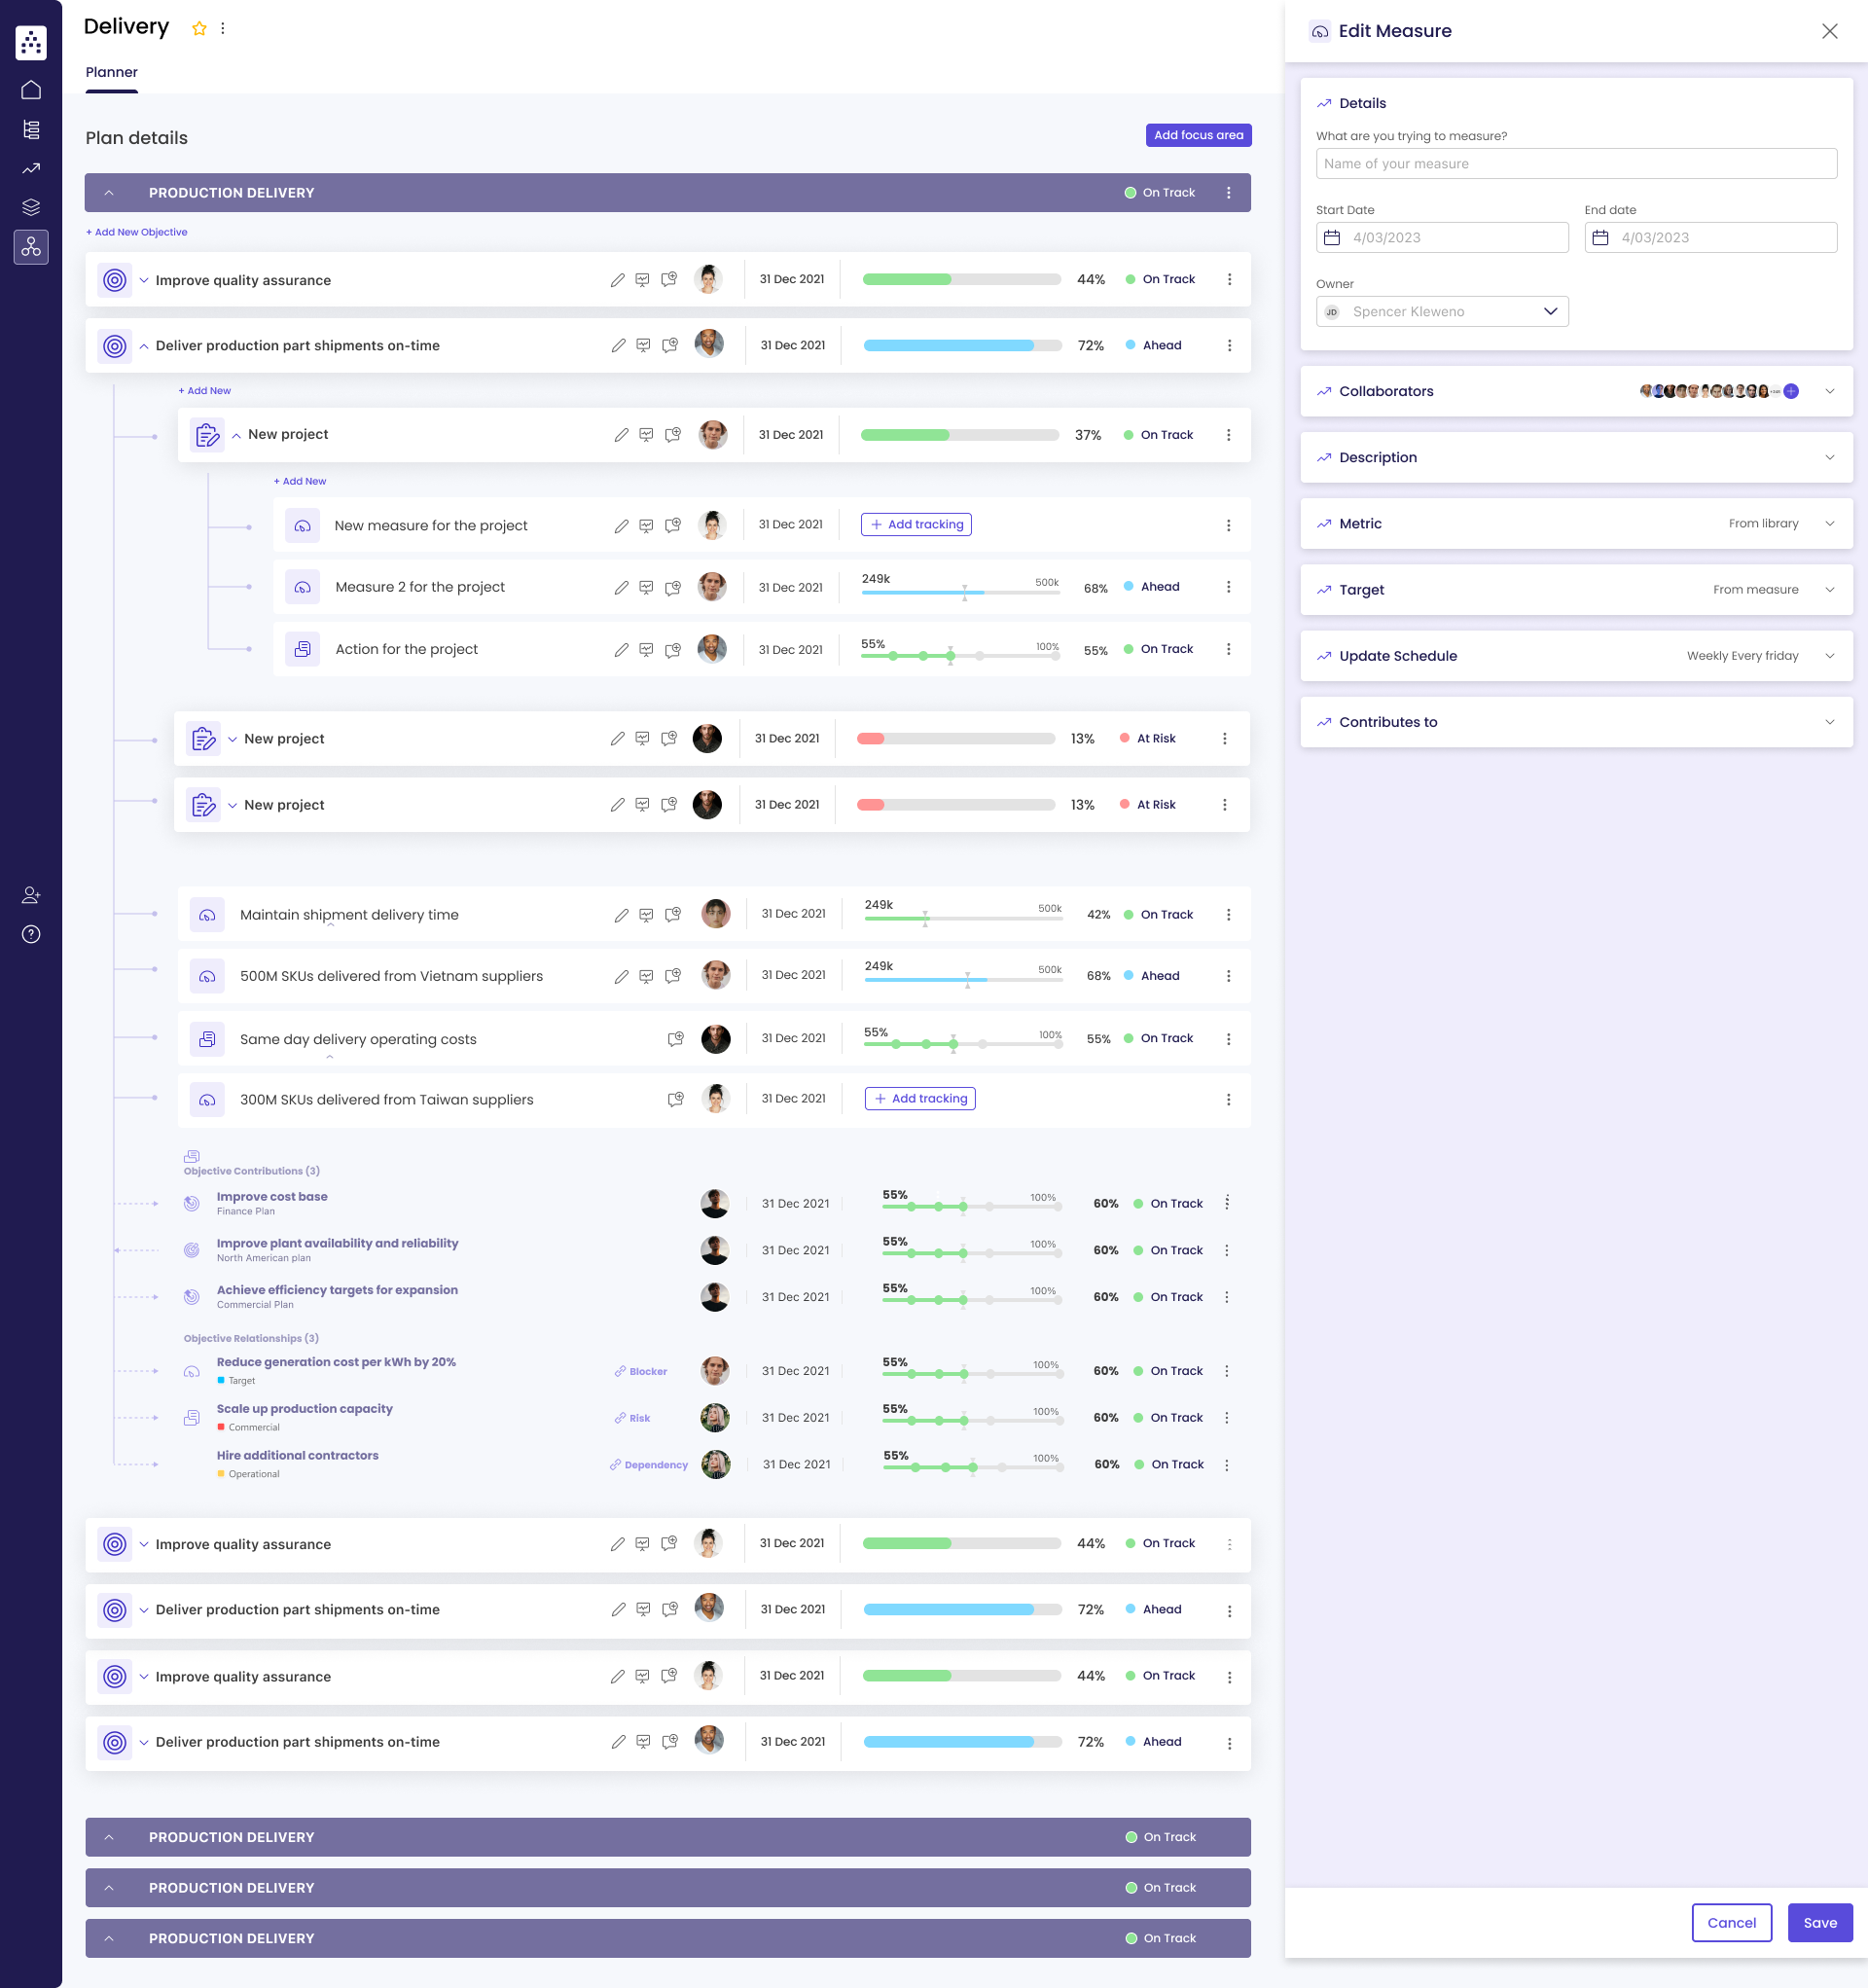
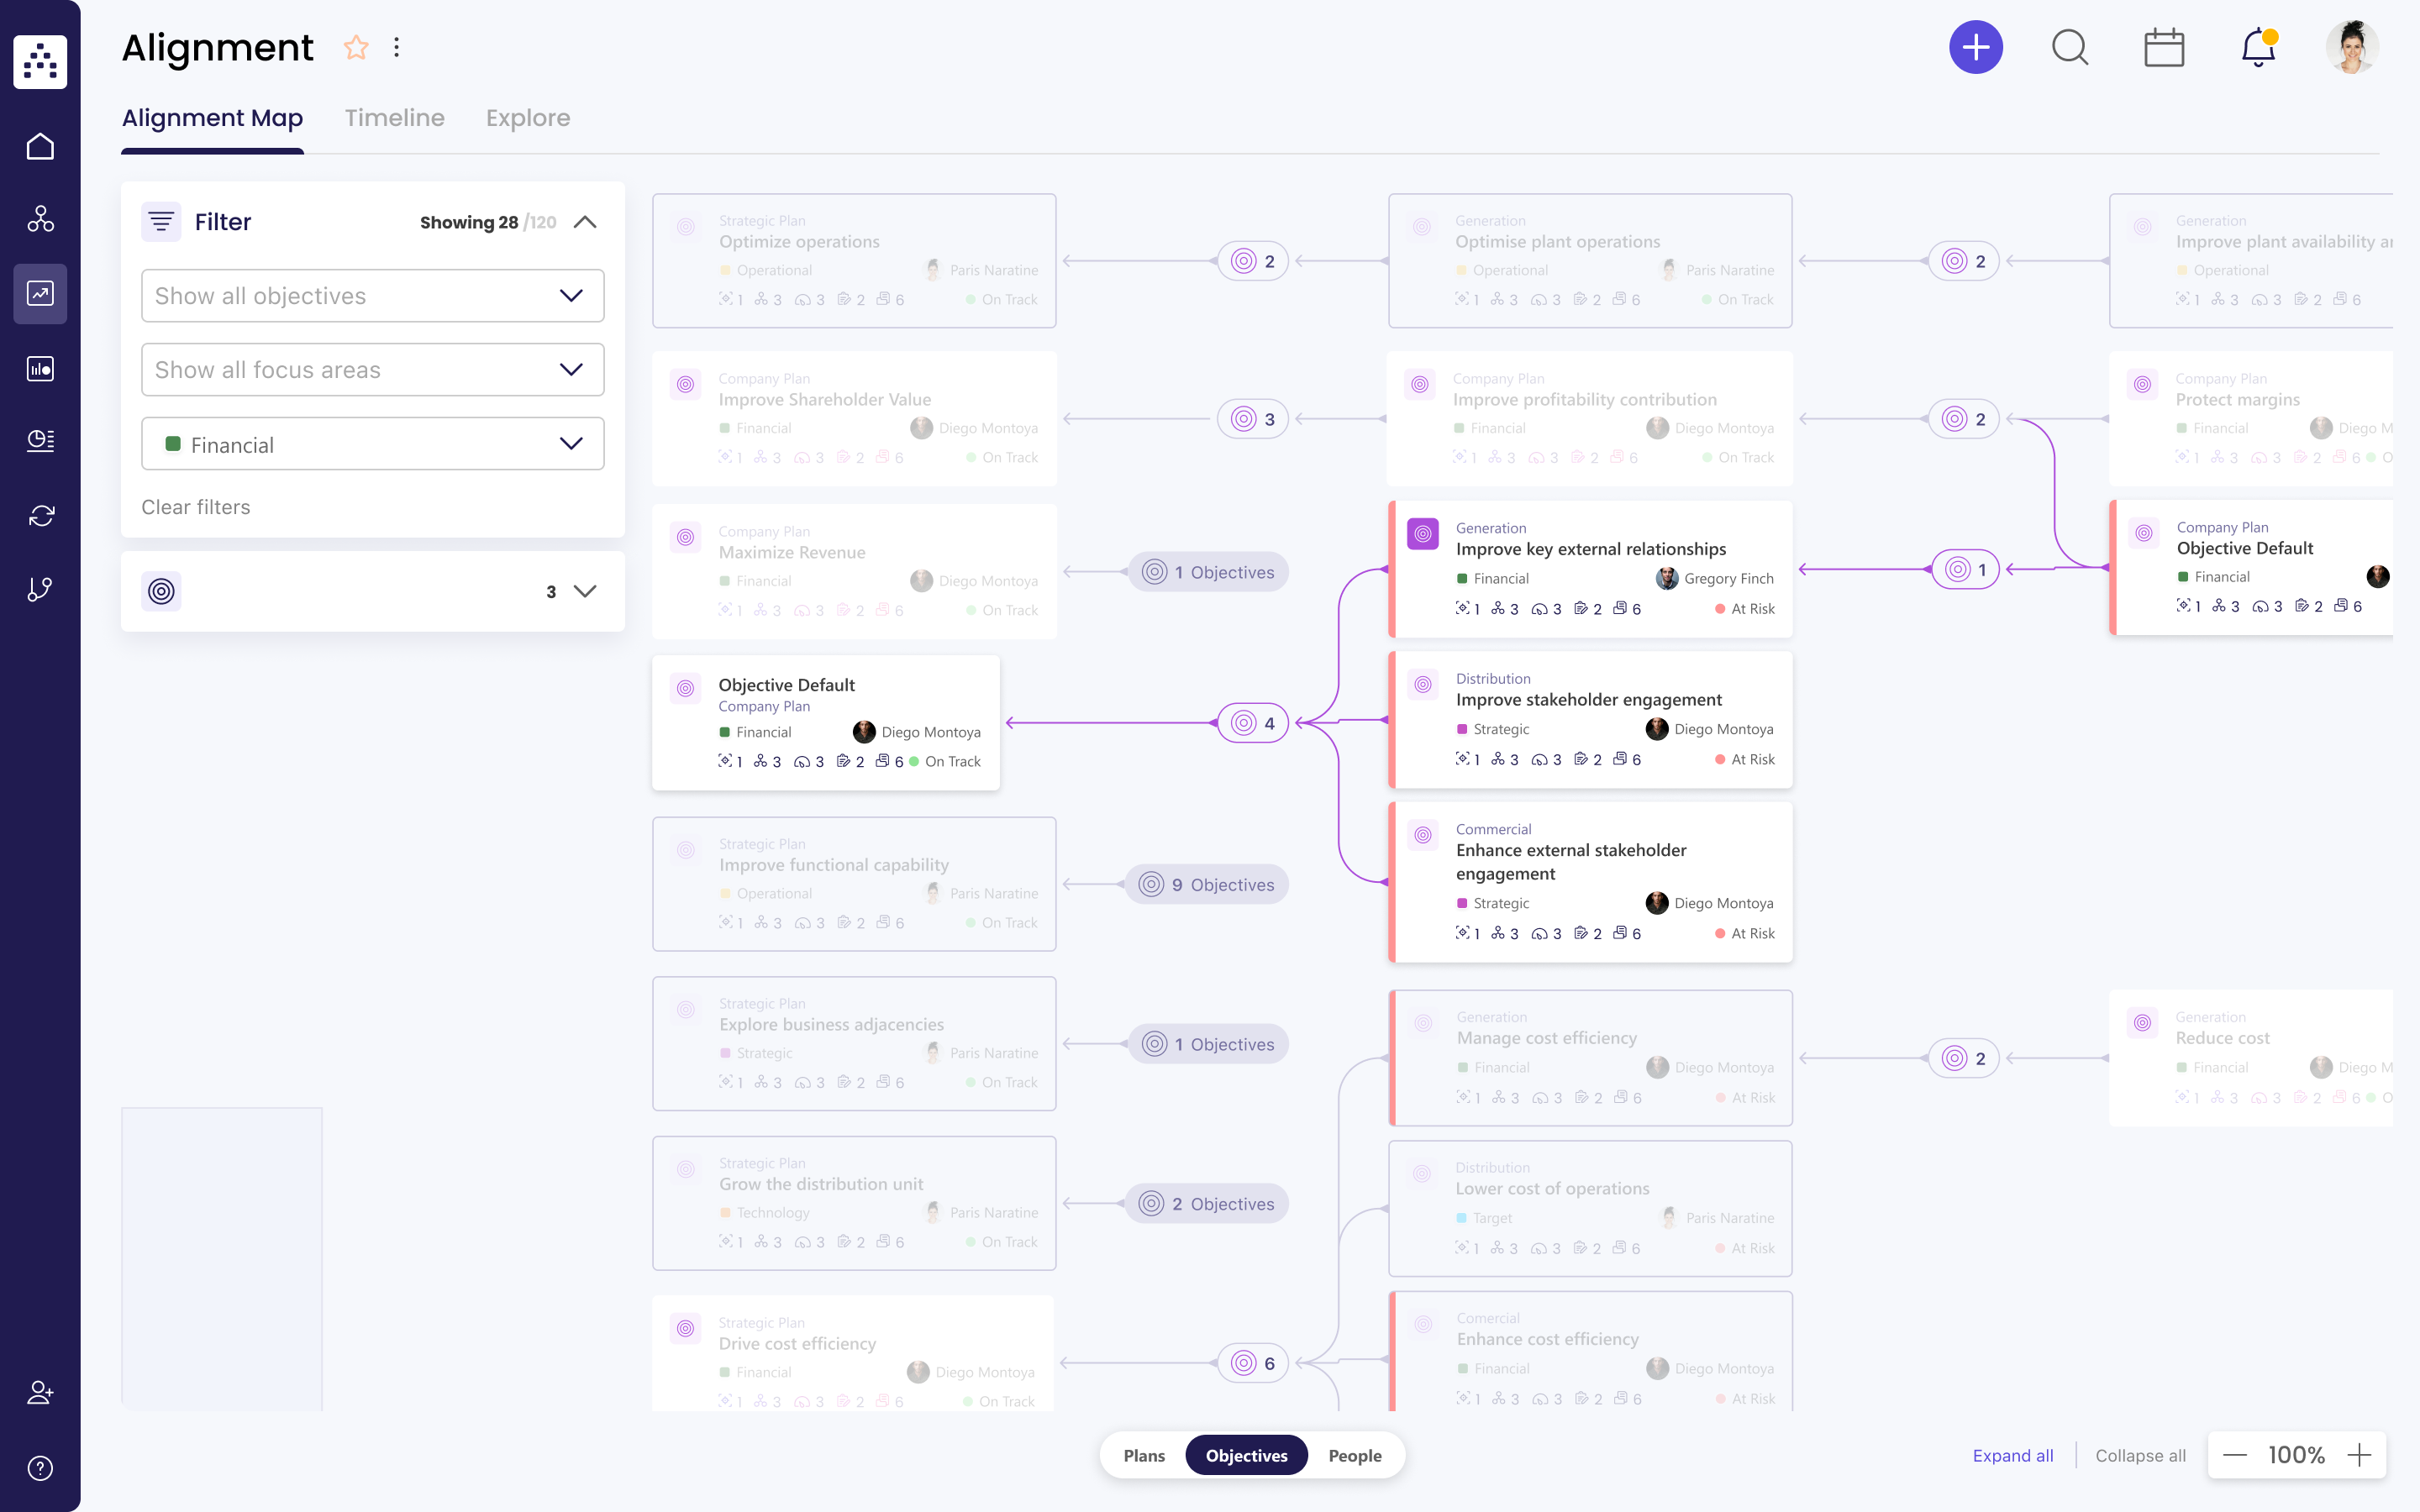
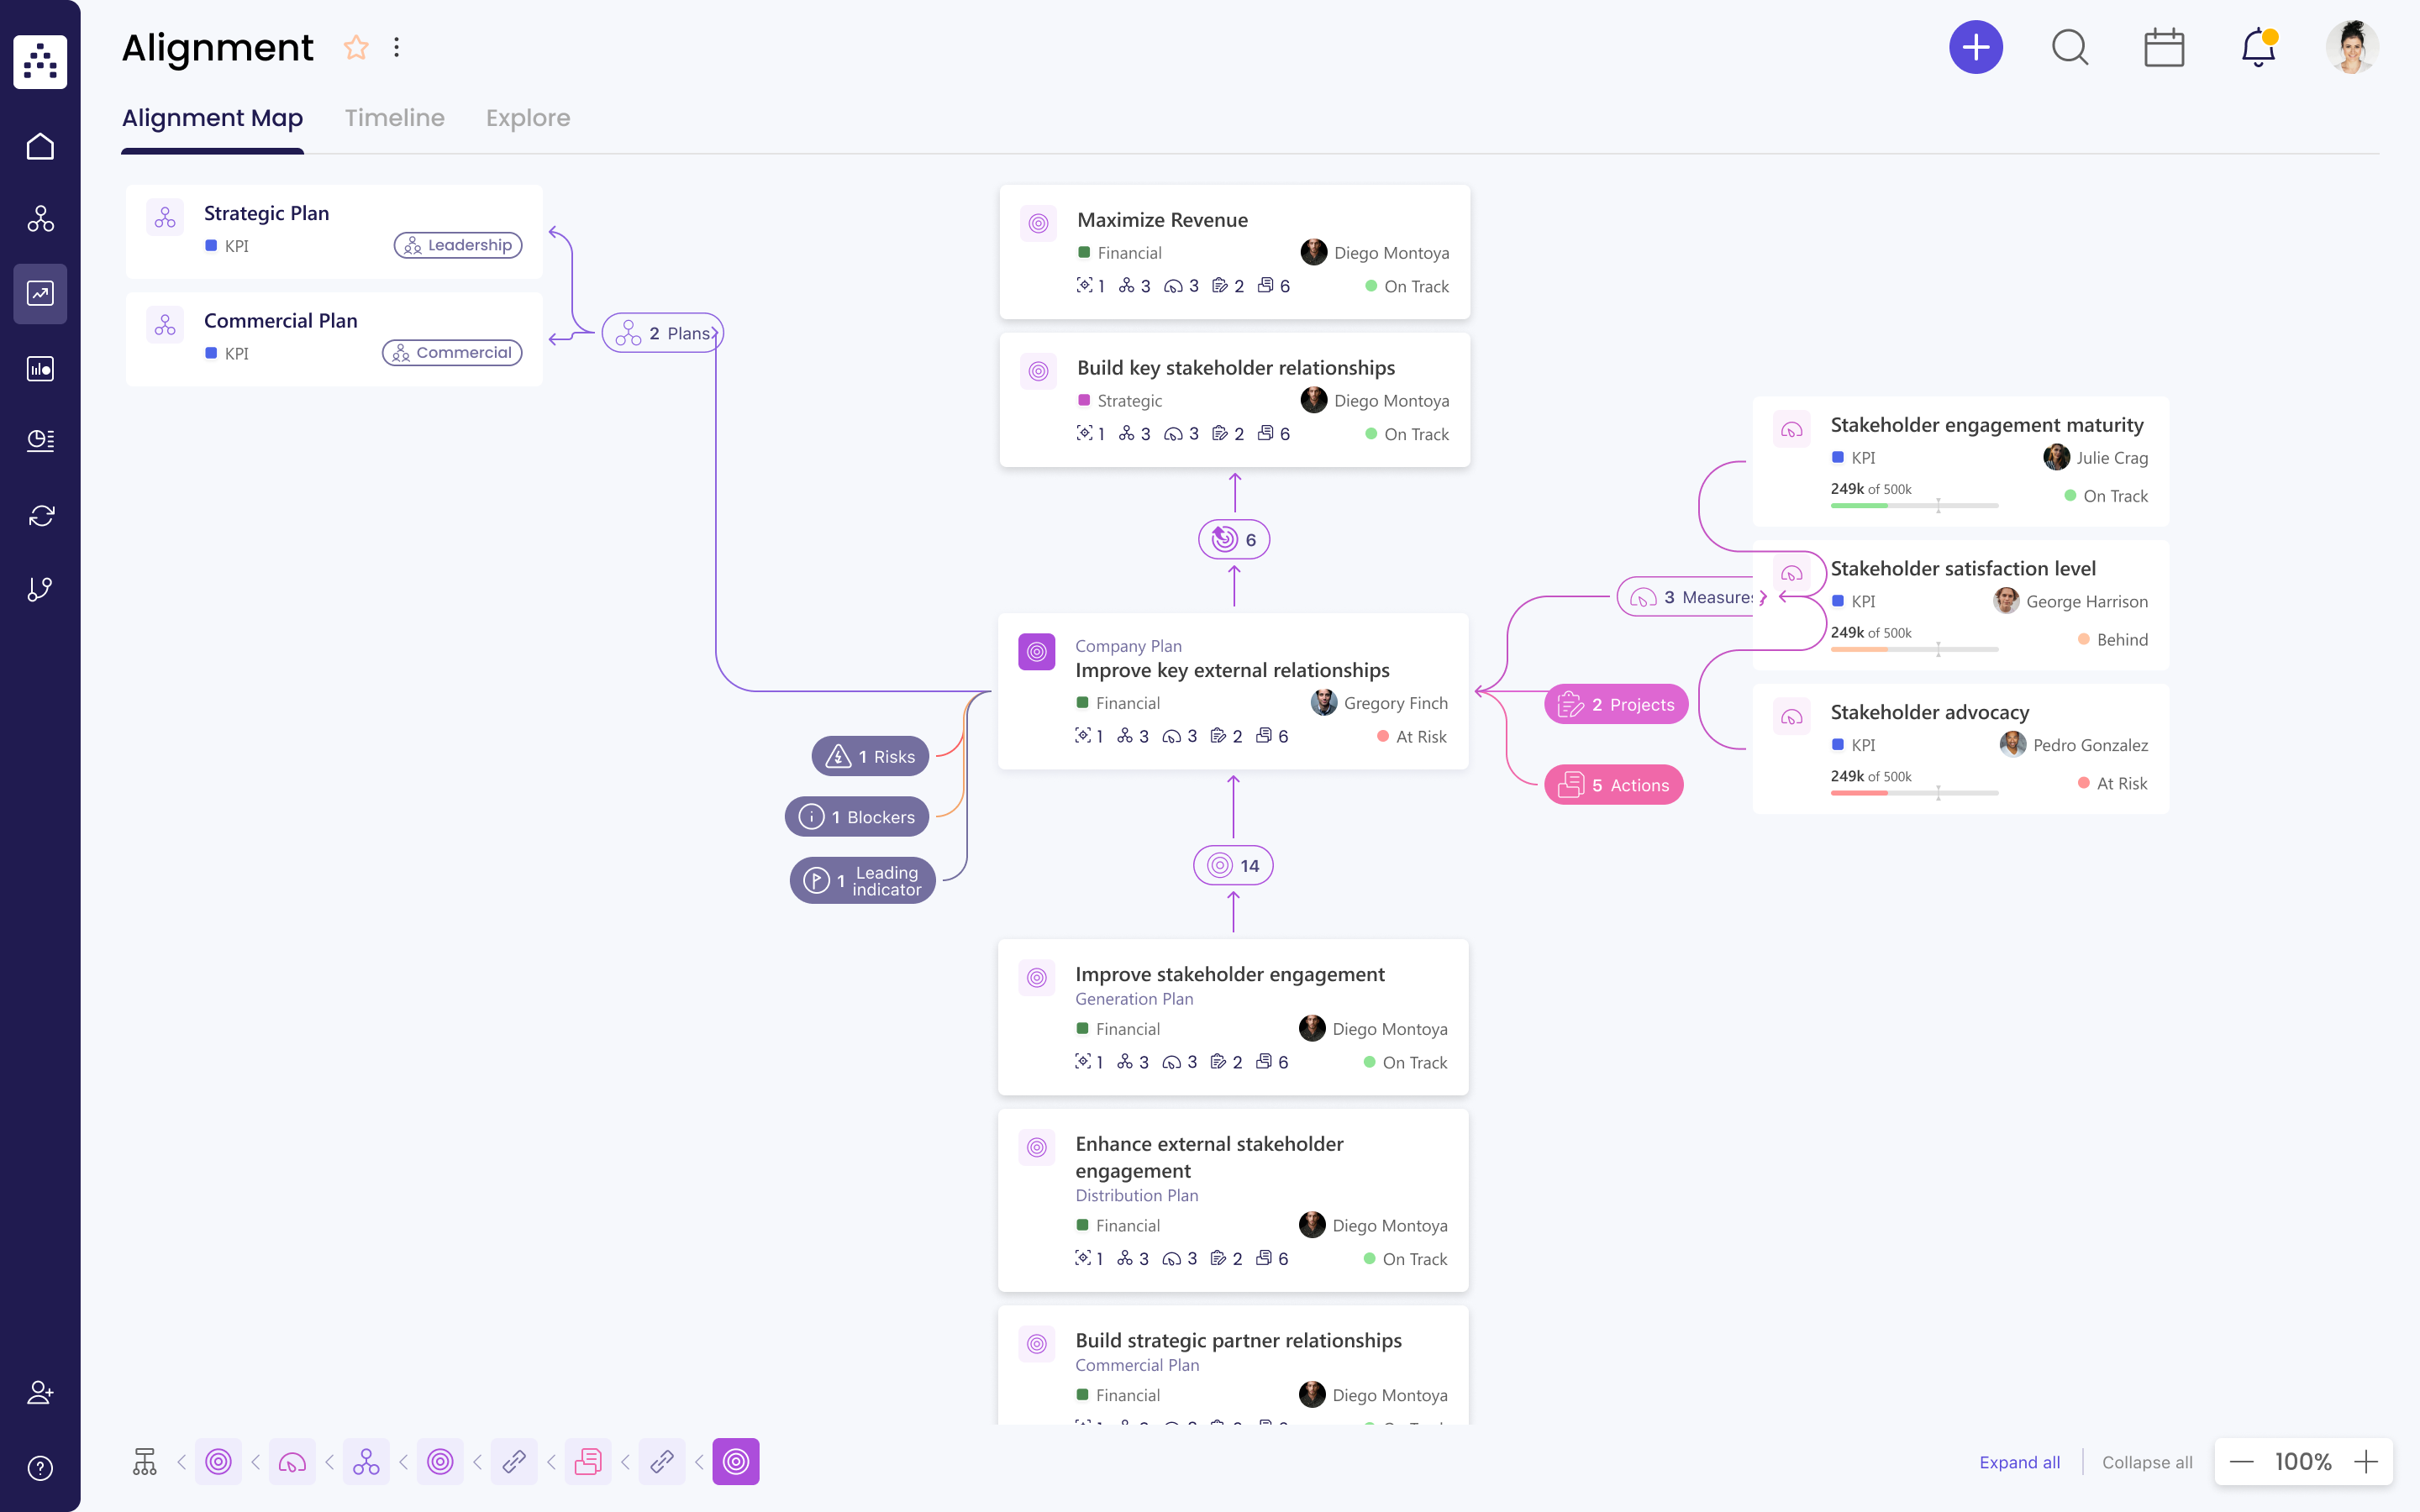
Currently the tool only visualize the company strategy on a linear hirearchical way.

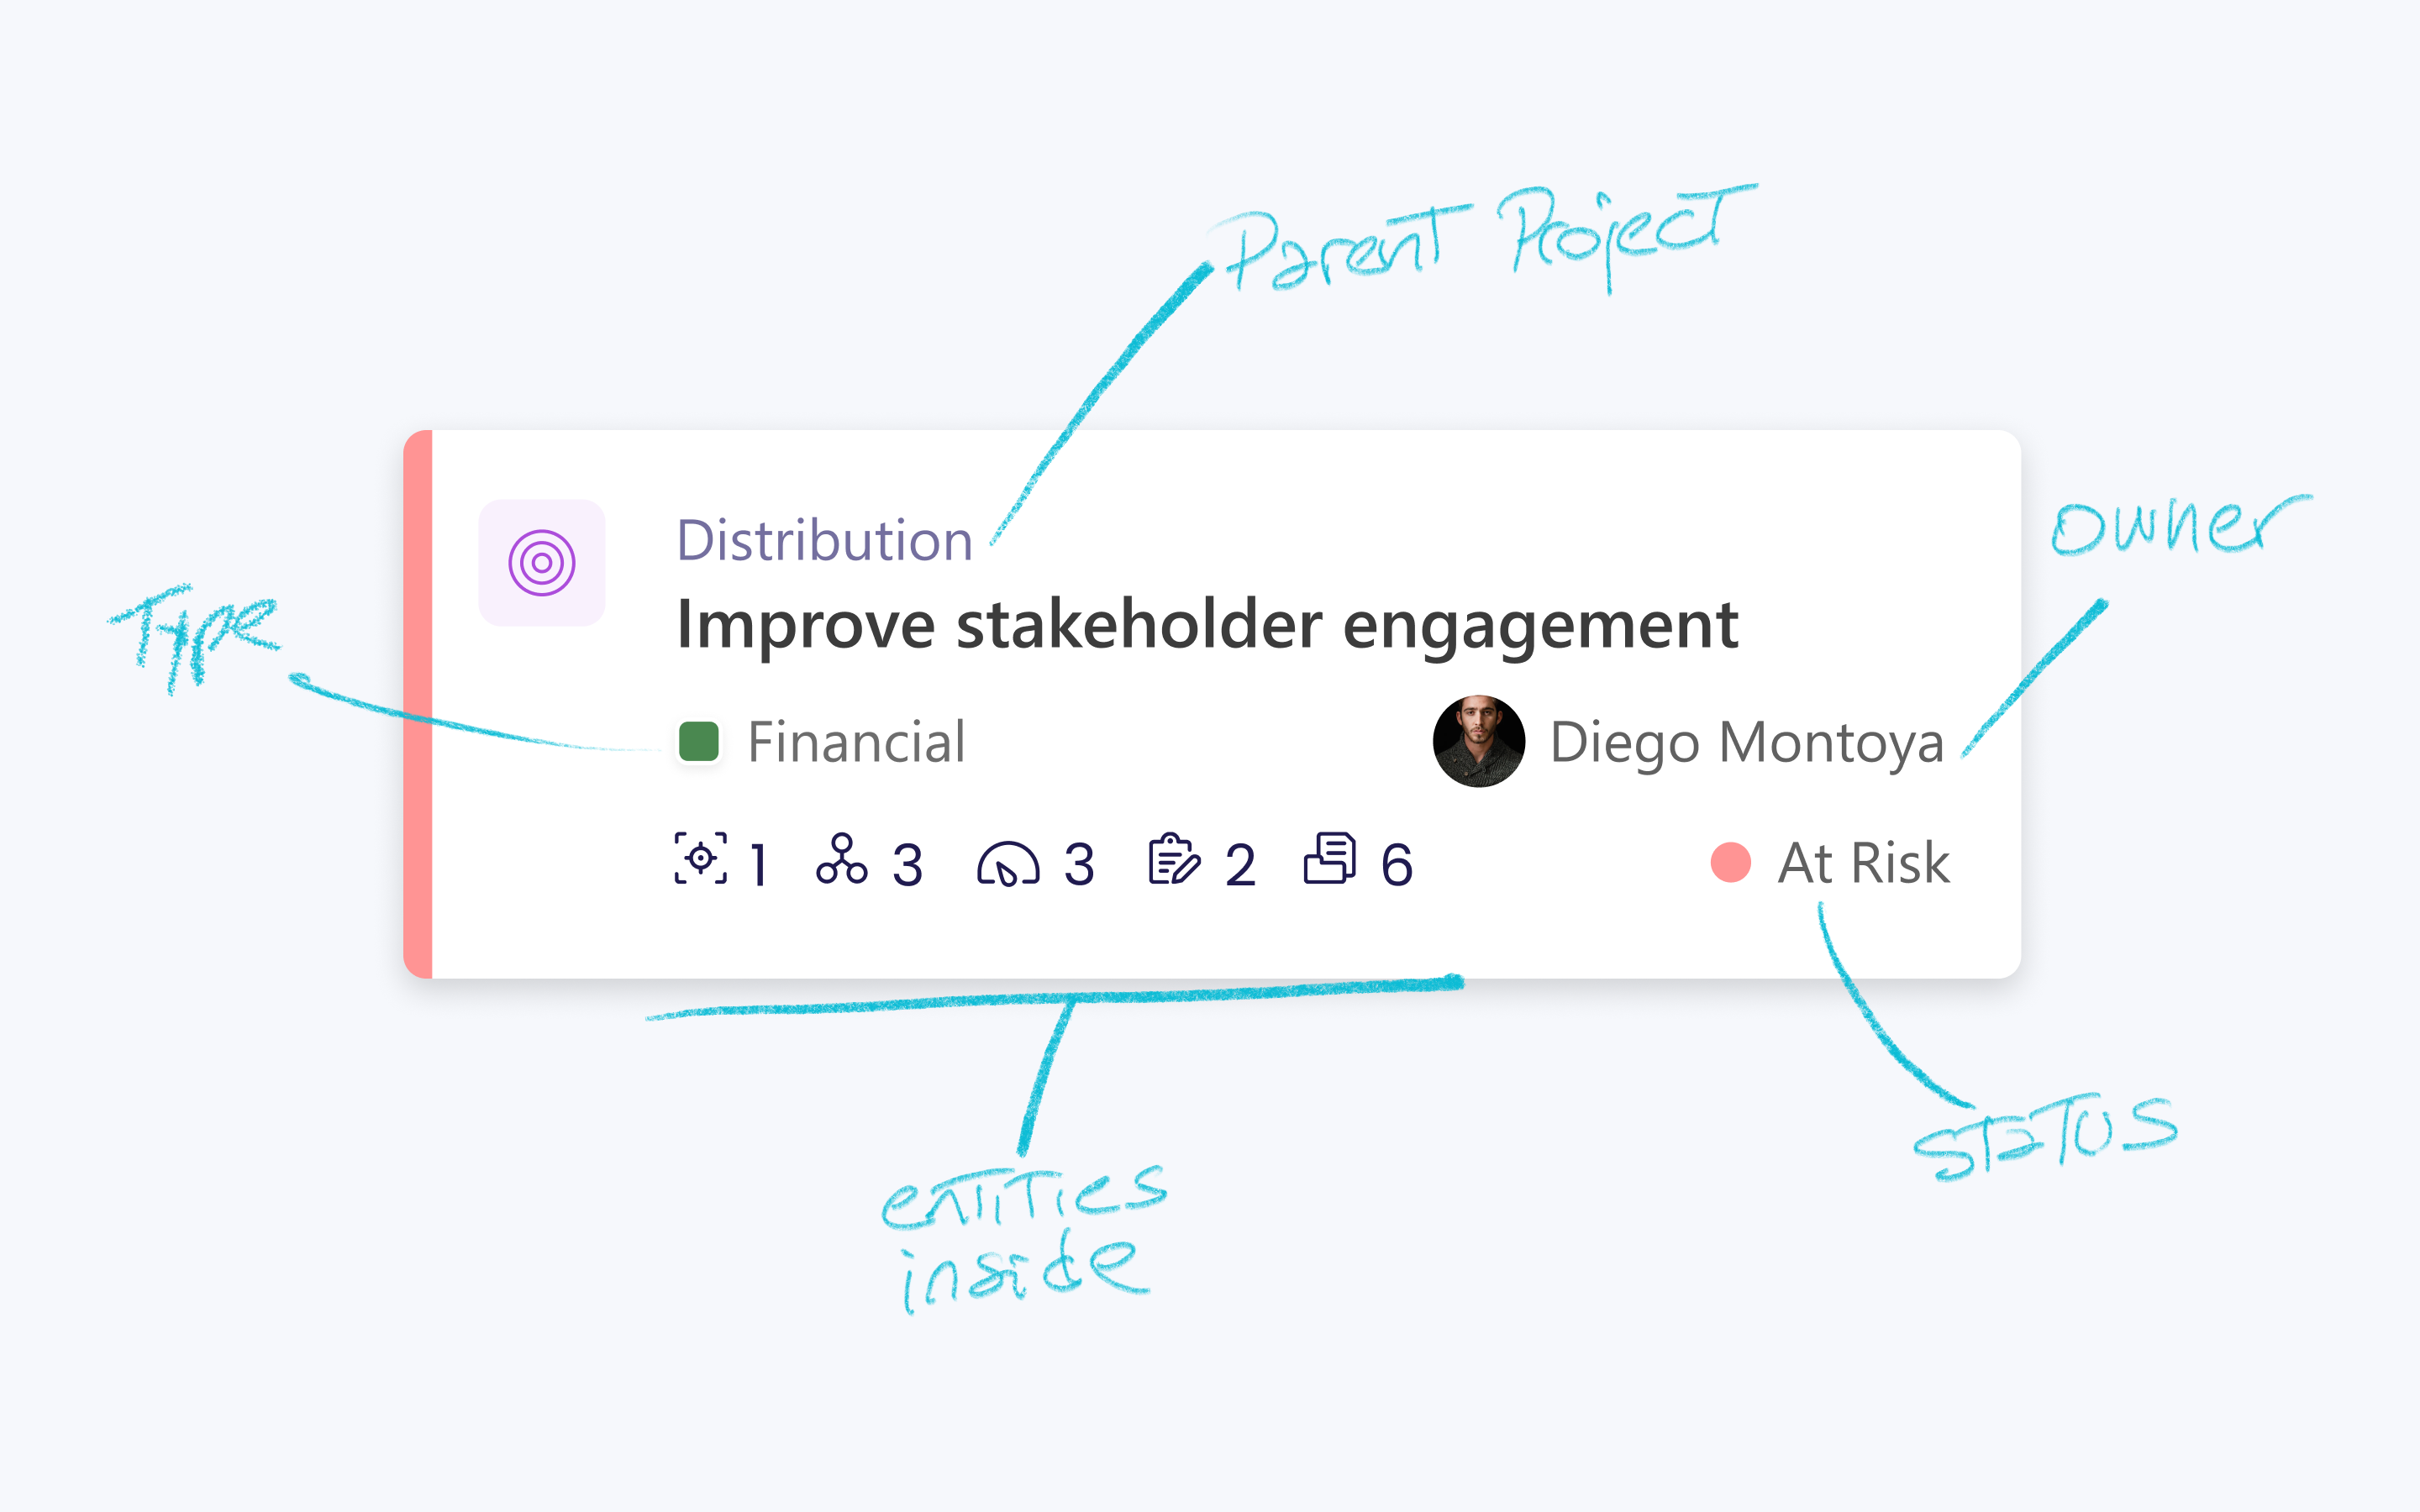
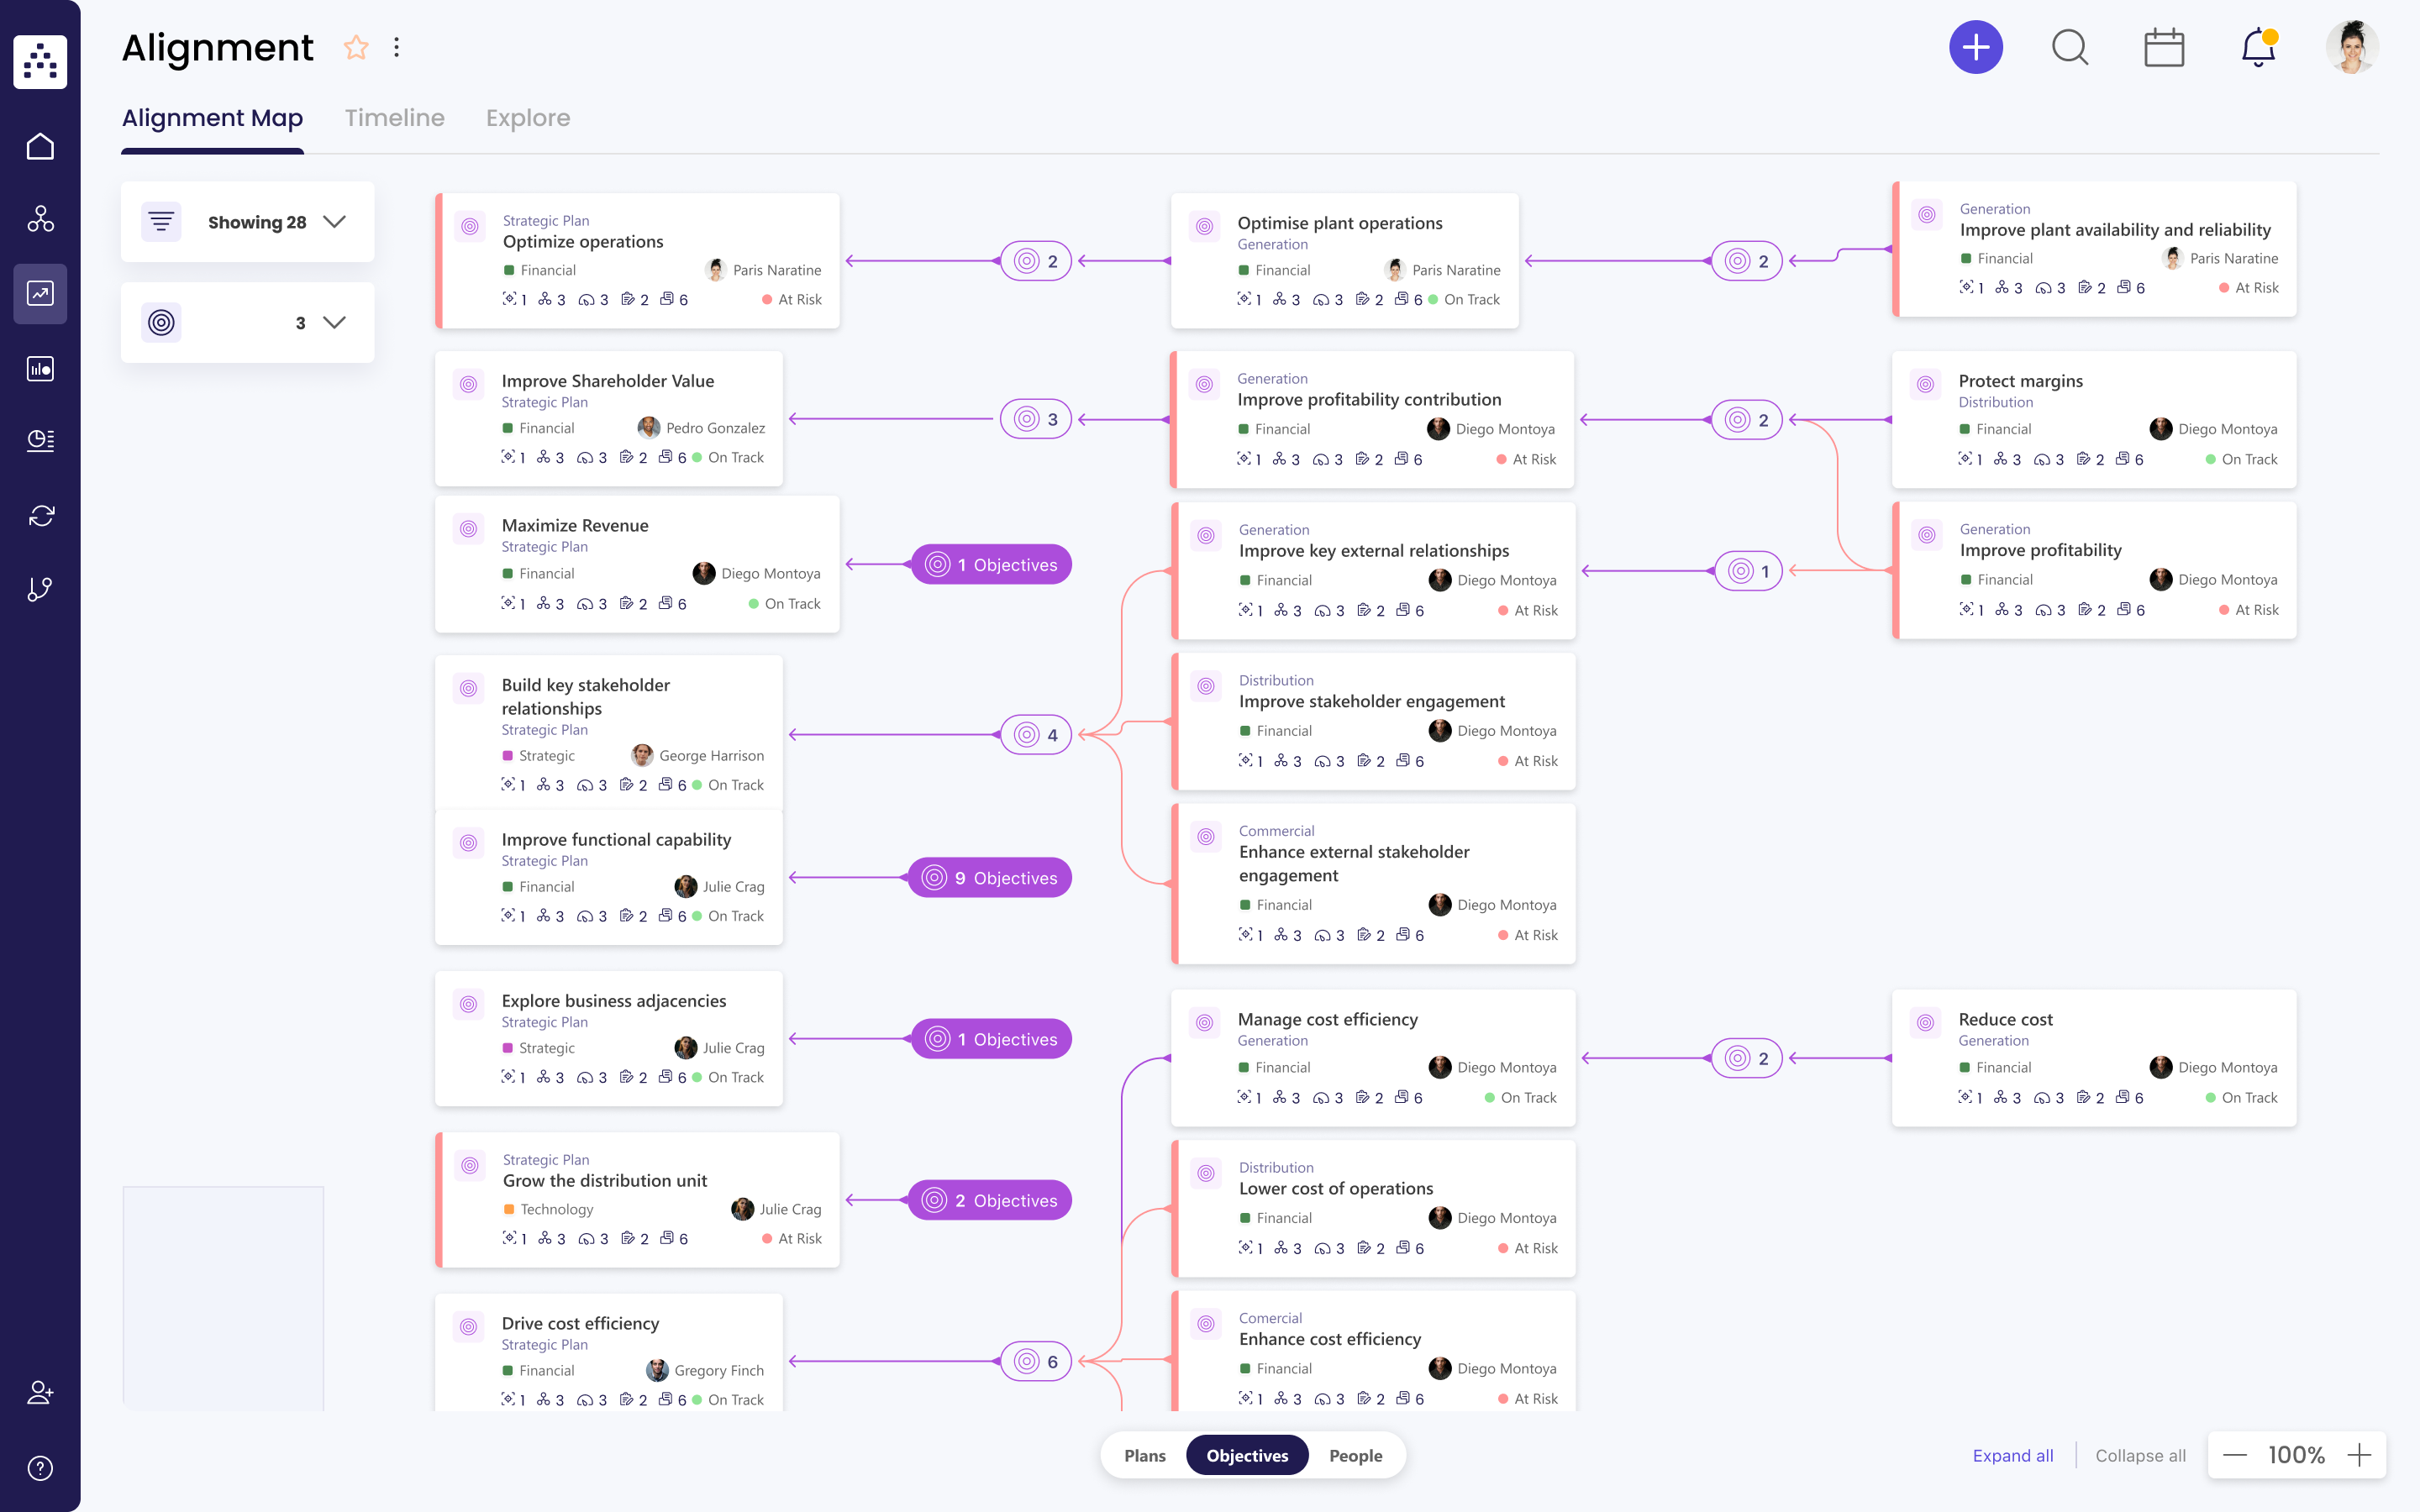
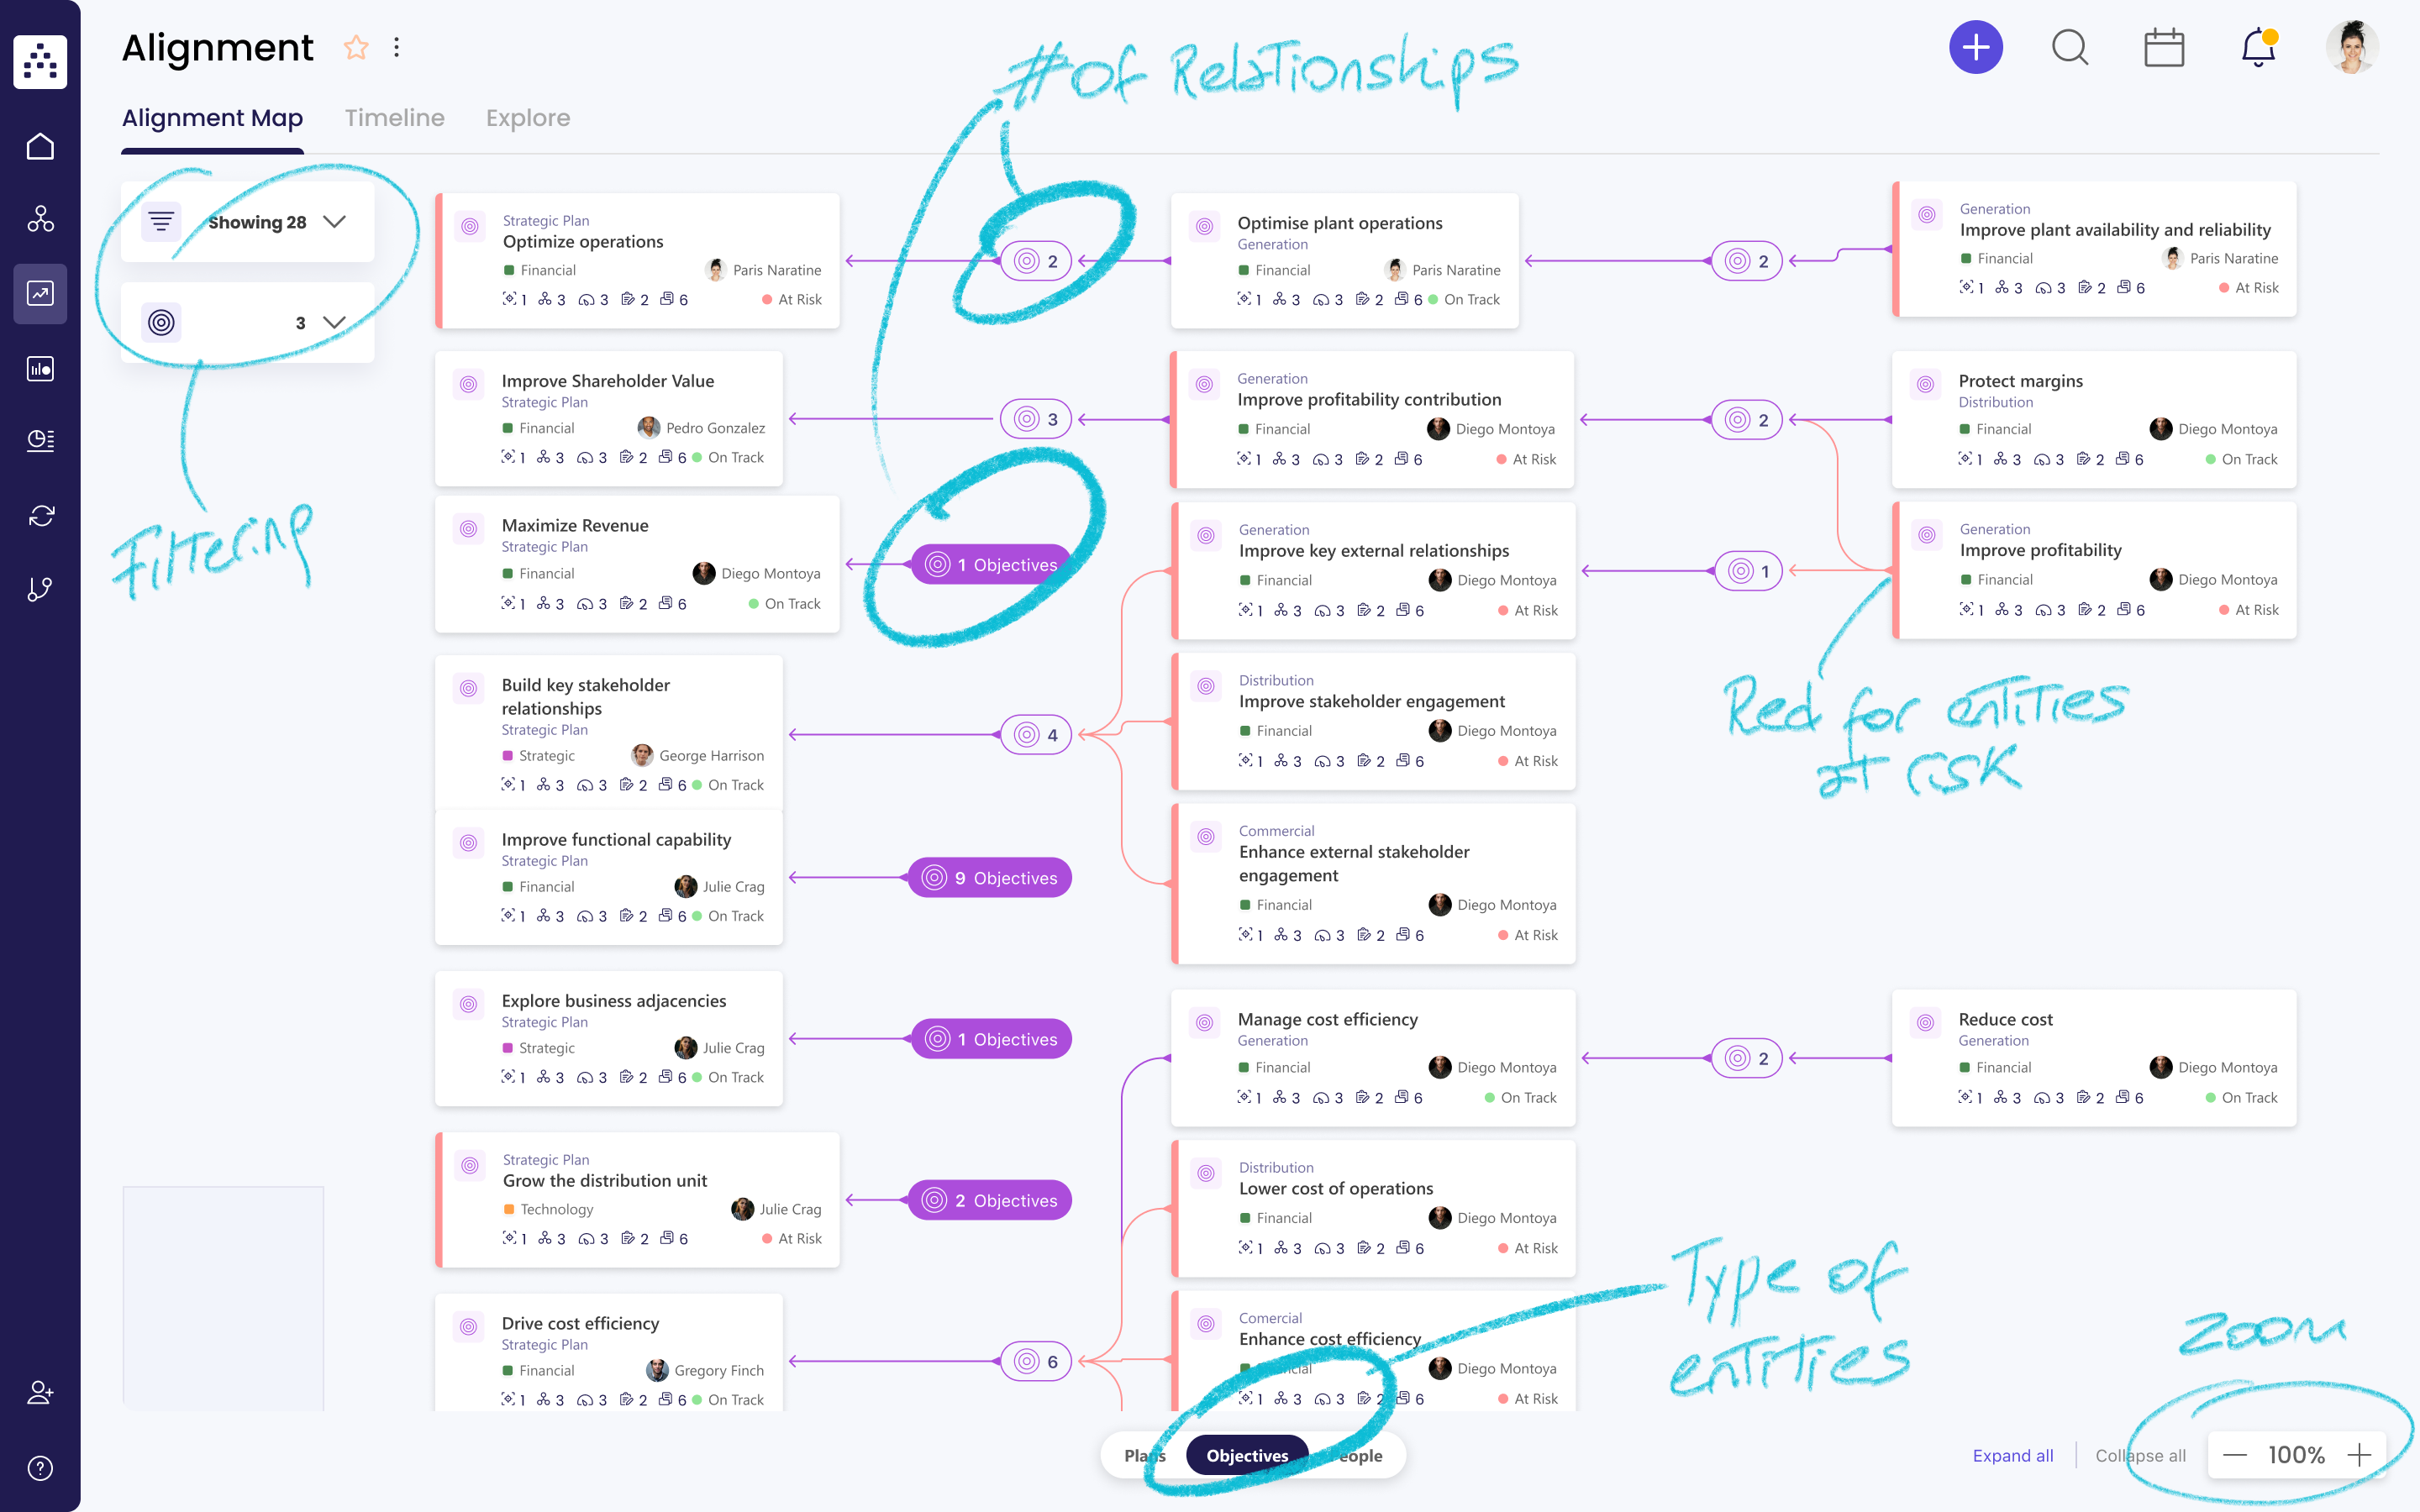
We need to give the users the abiltiy to see all their operational data in a way they can evaluate all the interrelations so they can detect and solve current and potential problems.

Research

We had 1:1 meetings with big current clients to understand what are the key interrelations of their company tasks and objectives so we can define how intricate or not those are.

Also we monitor all the Customer Service onboarding workshops so we could have more understanding on how the companies strategies are modeled.

We learned

  • Objectives are the primary entity to evaluate the company interrelations performance.
  • We made a list of type of relationships.
  • We got to make a list of type of relationships.
  • The users need to be able to see a macro and a micro view.

Proposal

The solution need to be interactive, no only a static display of entities, and it need to be flexible to show multiple and intricate relationships within big companies structures. We inclined to have an interactive infographic. One of the main inspirations were the subway maps on NYC and London as an initial start point of explorations.

Base entity module

Alignment map

Alignment map

Base entity interaction

Filtered view

Zoomed view to entity context view

Results

Reception on current clients was high.

Time on platform was increased by 17%, and metrics show this view driving it.

This feature drived conversion on new sales reducing churn by 10%.